Mean of Grouped Data


Mean of Grouped Data
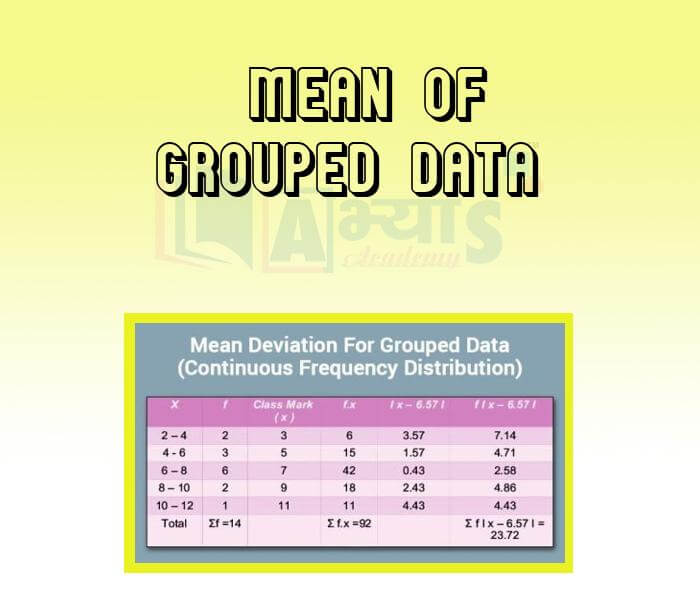
Mean Of Grouped Data:
Grouped data is data that has been grouped together in categories. Mean of a set of observations is the average of the given observations. To find the mean, we divide the sum of the observations by the total number of observations. However, for grouped data, we cannot find the exact Mean, we can only give estimates.
There are three methods for finding the mean from a grouped frequency table.
1. Mean Using Class Mark.
2. Assumed Mean Method
3. Step Deviation Method
Mean of Grouped Data Using Class Mark:
The mean (or average) of observations, as we know , is the sum of the values of all the observations divided by the total number of observations. For grouped data we will find the class mark for each class and denote it with for the respective class with frequencies
, In other way we say that the frequency denotes the number times the class mark is occurring. That is why the mean calculated using grouping is not accurate but is an estimate.
Now, the sum of the values of all the observations
and the number of observations
So, the mean of the data is given by
Illustration: Find the mean of the following data:
| Class interval | 10-25 | 25-40 | 40-55 | 55-70 | 70-85 | 85-100 |
| Number of students | 2 | 3 | 7 | 6 | 6 | 6 |
Solution
| Class interval | Number of students |
Class mark |
|
|
10-25 25-40 40-55 55-70 70-85 85-100 |
2 3 7 6 6 6 |
17.5 32.5 47.5 62.5 77.5 92.5 |
35.0 97.5 332.5 375.0 465.0 555.0 |
| Total |
While computing the mean of grouped data, we assume that the frequencies are ________________________. | |||
| Right Option : B | |||
| View Explanation | |||
Find the mean of grouped data can be calculated using __________________ .
| |||
| Right Option : D | |||
| View Explanation | |||
If the mean of the following distribution is 20. The value of x is _____________.
| |||||||||||||||
| Right Option : A | |||||||||||||||
| View Explanation | |||||||||||||||
Students / Parents Reviews [10]
My experience with Abhyas is very good. I have learnt many things here like vedic maths and reasoning also. Teachers here first take our doubts and then there are assignments to verify our weak points.

Shivam Rana
7thOne of the best institutes to develope a child interest in studies.Provides SST and English knowledge also unlike other institutes. Teachers are co operative and friendly online tests andPPT develope practical knowledge also.

Aman Kumar Shrivastava
10thAbhyas Methodology is very good. It is based on according to student and each child manages accordingly to its properly. Methodology has improved the abilities of students to shine them in future.

Manish Kumar
10thIt was good as the experience because as we had come here we had been improved in a such envirnment created here.Extra is taught which is beneficial for future.

Eshan Arora
8thIt has a great methodology. Students here can get analysis to their test quickly.We can learn easily through PPTs and the testing methods are good. We know that where we have to practice

Barkha Arora
10thAbout Abhyas metholodology the teachers are very nice and hardworking toward students.The Centre Head Mrs Anu Sethi is also a brilliant teacher.Abhyas has taught me how to overcome problems and has always taken my doubts and suppoeted me.

Shreya Shrivastava
8thIt was a good experience with Abhyas Academy. I even faced problems in starting but slowly and steadily overcomed. Especially reasoning classes helped me a lot.

Cheshta
10thAbhyas is a complete education Institute. Here extreme care is taken by teacher with the help of regular exam. Extra classes also conducted by the institute, if the student is weak.

Om Umang
10thA marvelous experience with Abhyas. I am glad to share that my ward has achieved more than enough at the Ambala ABHYAS centre. Years have passed on and more and more he has gained. May the centre flourish and develop day by day by the grace of God.

Archit Segal
7thBeing a parent, I saw my daughter improvement in her studies by seeing a good result in all day to day compititive exam TMO, NSO, IEO etc and as well as studies. I have got a fruitful result from my daughter.